
New direct drive base, new wheel, and amplified enjoyment.
That’s exactly what I felt from the very first laps with this new configuration. With this P1 SIM bundle, everything feels connected: the wheel, the pedals, the base, as if each component speaks the same language.
Nothing operates independently because each element communicates within a coherent system.
My goal here isn’t to “test” hardware, but to pursue the protocol: to understand how every parameter influences the signal, and how the signal becomes sensation.
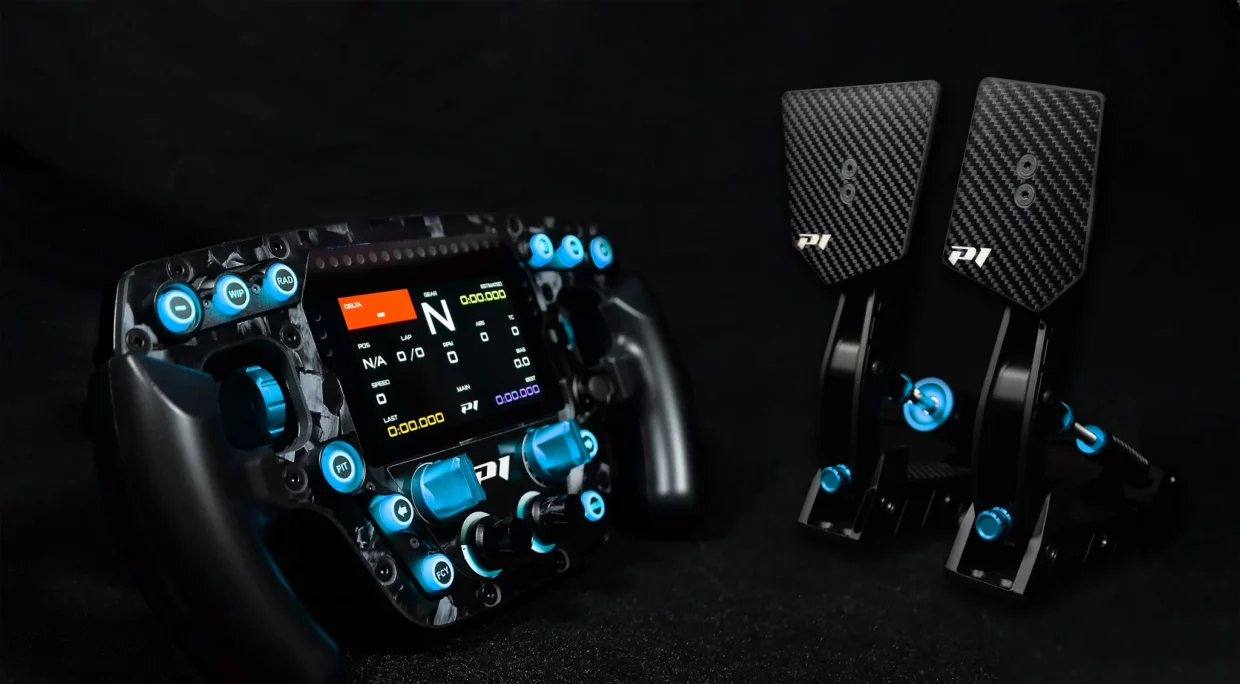
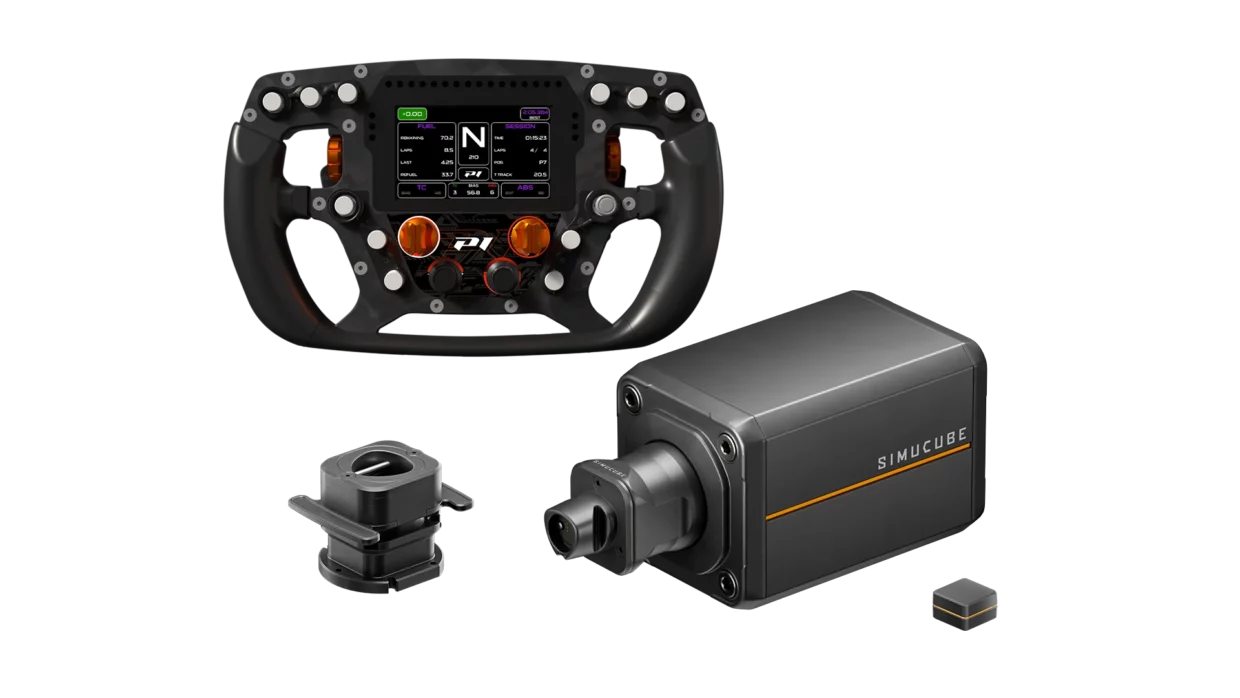
The Eau Rouge Apex wheel, the Mistral pedal set, and the SimuCube 2 Sport base form a triad capable of translating the game’s physics into a tangible experience. And the further I go, the more I realize that accuracy comes less from power than from coherence.
I’d wanted to take this step for a long time: a new direct drive base. It’s done — and I have no regrets. SimuCube is another dimension.
I loved the ClubSport DD, but here we’re brushing up against purity: a clean, frank, readable signal. Every vibration tells a story. Every torque variation becomes a word in the chassis’ language.
But enough lyricism — back to method, because behind every sensation there’s a measurement, an equation, a logic. That’s what I’m pursuing: the Push Lap Garage protocol.
Steering Lock
I always start here: lock.
It’s step number one on my list. It defines torque linearity and the direct relationship between input and data.
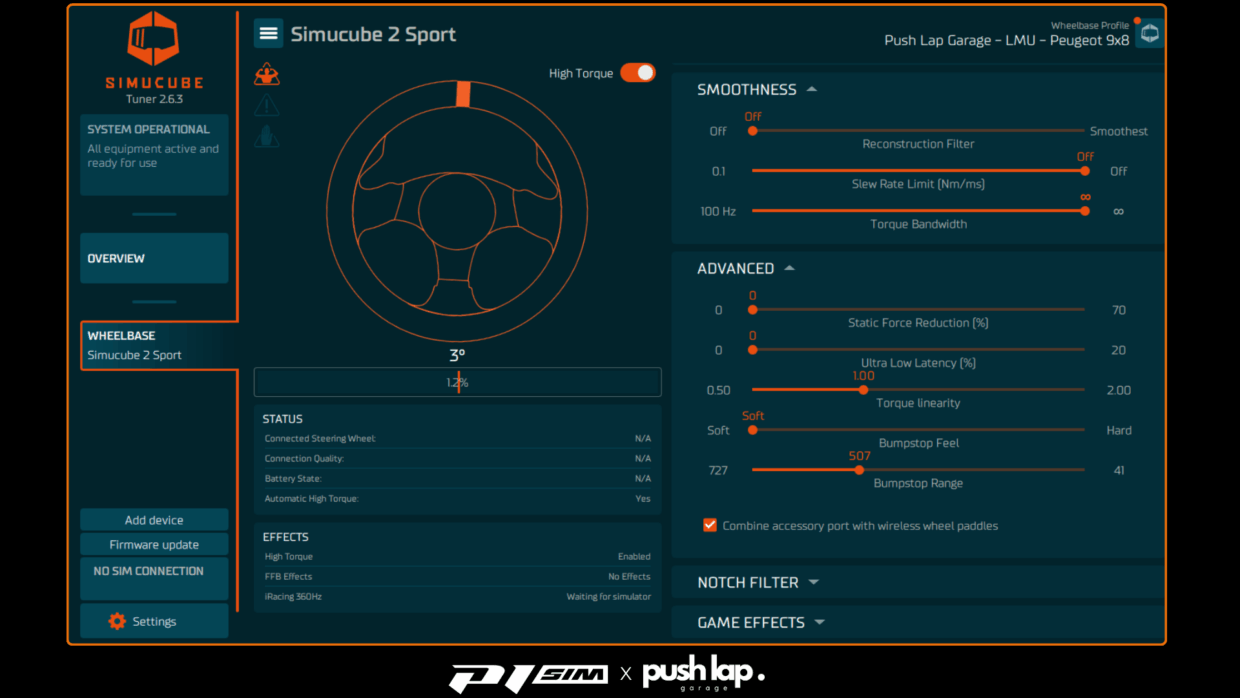
On the Peugeot 9X8, the exact value is 527°.
You can use the automatic lock in the game, but if you want to be sure you’re using the physics perfectly, I recommend locking 520° in the calibration menu.
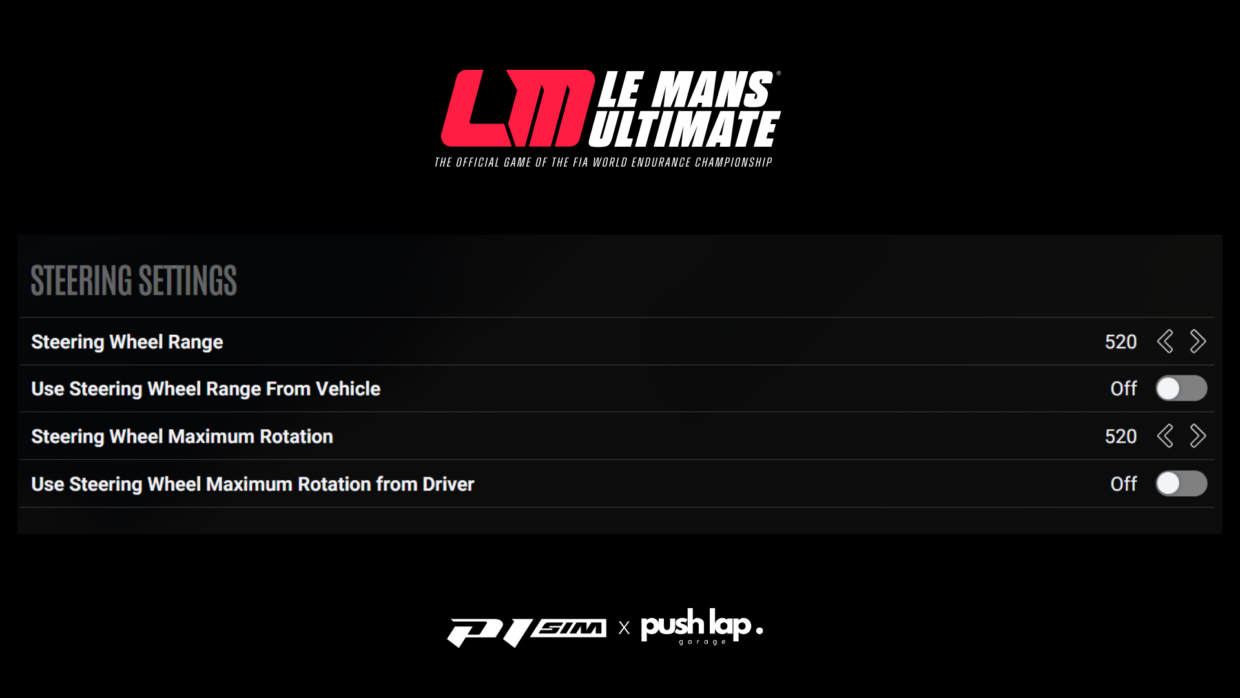
Then it’s enough to create a profile specific to the vehicle and manually enter 527° for the lock in the SimuCube software.
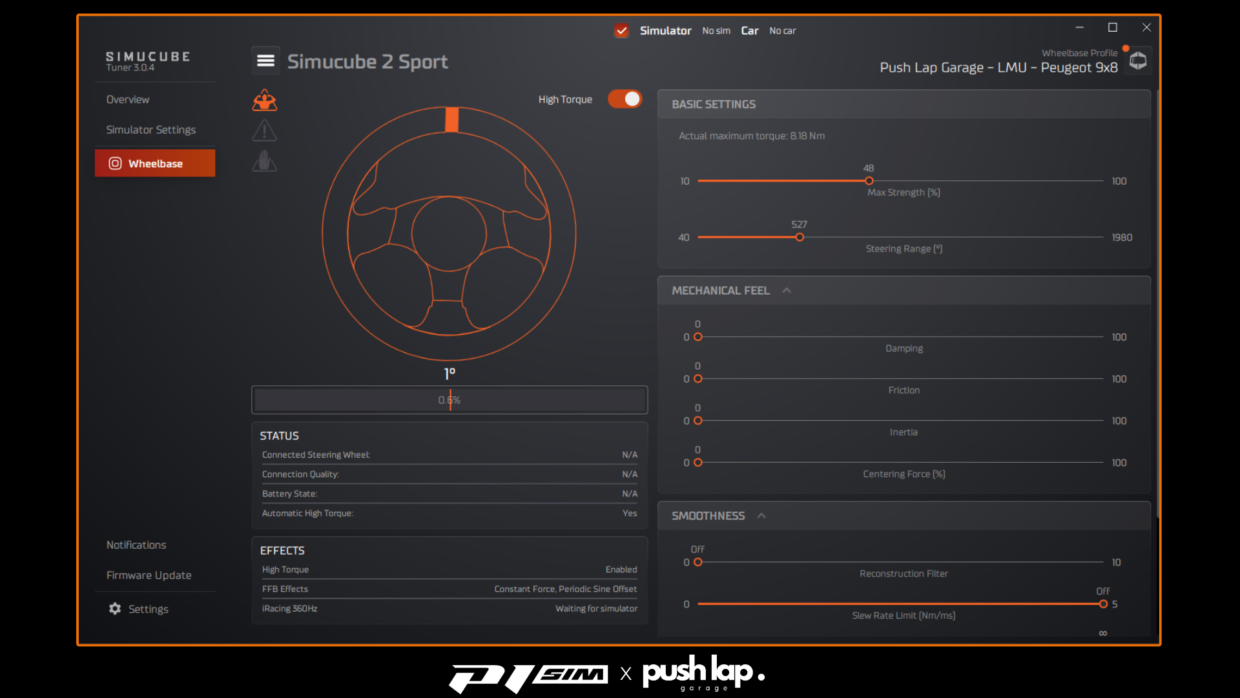
This two-part setup guarantees a perfect match between the virtual wheel and the real one. Steering becomes clean, precise, with no angular compression.
And you feel it immediately: once the value is correct, the base stops interpreting and faithfully reproduces the physics. Lateral forces no longer twist, self-centering is crisp, and the wheel remains neutral in transitions.
This is the first step of the protocol: lock the geometry to free the signal.
Seat Height and the Tarmac’s Frequency Projection
Once the steering is locked, I move on to the virtual driver position — specifically seat height. It’s often overlooked, but on the 9X8 it actually determines how the tarmac speaks through the wheel.
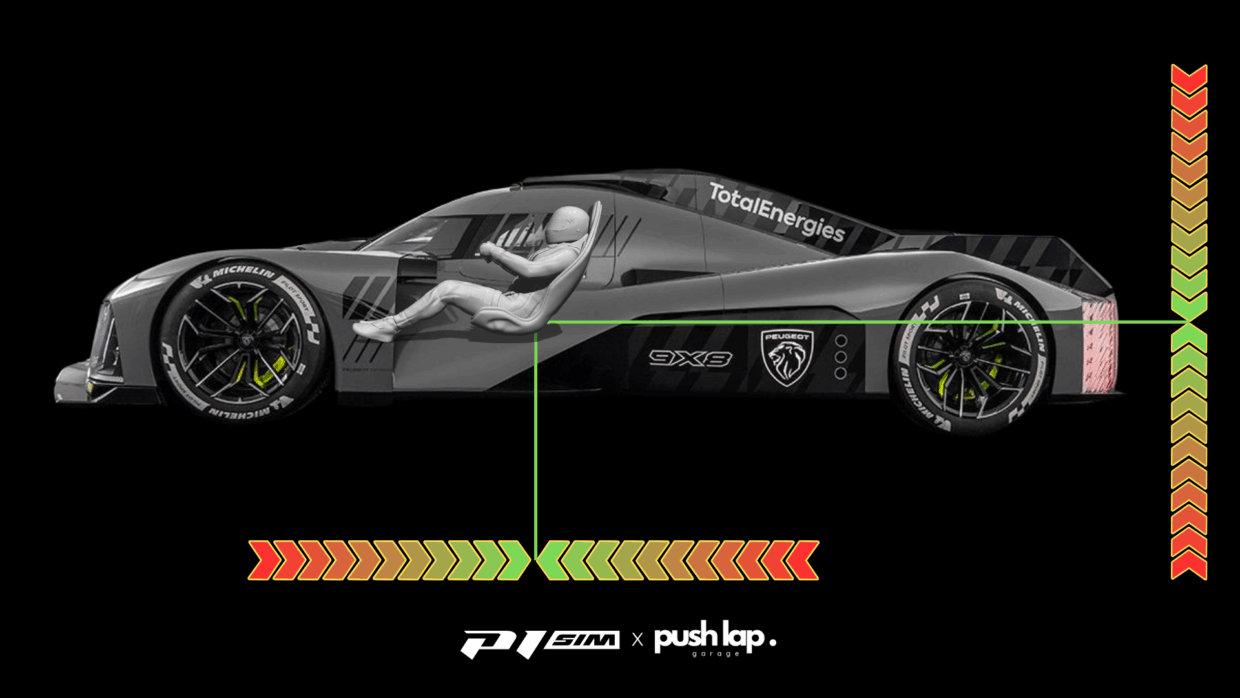
At first glance, height looks like ergonomics. In reality, it acts as a frequency filter.
Changing height shifts the application point of virtual forces (Fx, Fy, Fz, Mz) onto the steering column, and therefore changes the frequency bands the base transmits.
Over the course of testing, I found a perfect balance at +9 at Interlagos.
In my first runs I was still at +6, but a new round of measurements showed that +9 offers a more faithful rendering in the 20–60 Hz band: grip, micro-slides, surface texture. The chassis vibrated naturally; grip was clear without excess.
Conclusion: height influences the feel of mechanical grip, and that grip varies with the tarmac → a track-by-trackadjustment is required.
This finding aligns with Lötzsch et al. (2019): the higher the driver’s inertial center, the more the wheel transmits mid/high frequencies (20–60 Hz) (grip, texture). Conversely, lowering the seat reinforces low frequencies (0–15 Hz)(mass, stability).
From then on, I stopped seeing seat height as a visual choice and started treating it as an acoustic parameter in the simulator’s spectrum.
I still had to set the fore–aft projection (which governs perceived balance).
Why does this matter, you might ask?
Just like the height parameter, fore–aft adjustment helps balance the physics not only with respect to our FOV (Field of View), but also the resolution in use.
With a vertical FOV of 44 and screen resolution of 10320×1440, -9 (longitudinal) perfectly balances forces for me.
To be completely precise, we carried out a battery of tests on different tracks available in the sim. You’ll notice a minimal difference between tarmac types.
Of course, several variables exist — weather, track temperature, or even track state (green, high grip).
These can influence your result, as can your own seating position in the cockpit.
Here are the results, track by track
Algarve -09 /+09*
Imola -09 /+09*
Monza -09 /+09*
Interlagos -09 /+09*
Bahrain -09 /+09*
Le Mans -09 /+09*
Spa-Francorchamps -09 /+09*
COTA -09 /+09*
Fuji -09 /+09*
Lusail -09 /+09*
Sebring -09 /+09*
Silverstone -09 /+09*
*Field of View:44 / Screen resolution: 10320×1440
*Measurements taken in dry weather, tarmac temperature 40°C
Force Feedback
This is where everything converges.
All the measurements and settings only make sense once the wheel is moving. It’s also where the most scientific part of the protocol begins: measuring, understanding, and translating real force into perceived force.
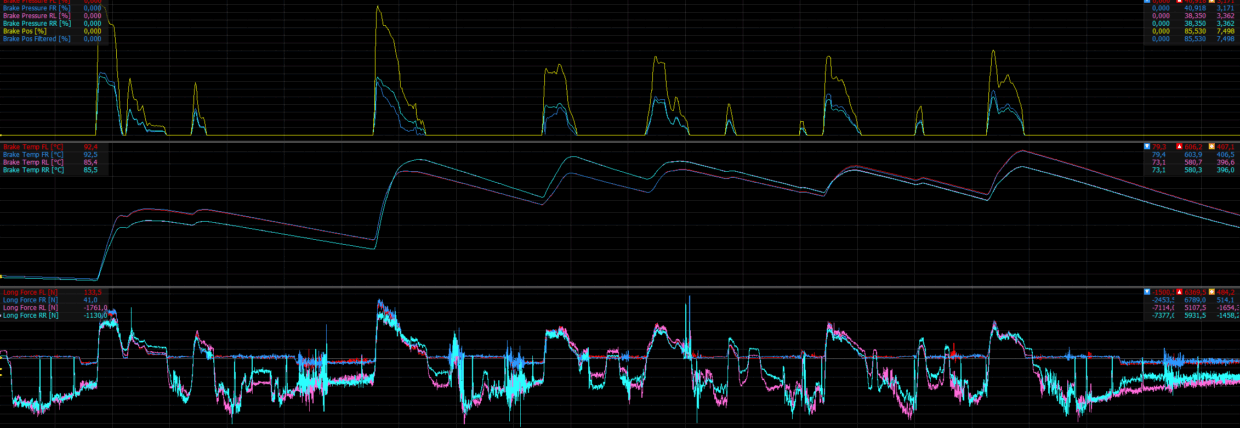
For that, I use MoTeC i2 Pro and its Steering Shaft Torque (Nm) channel — the torque applied by the motor to the column.
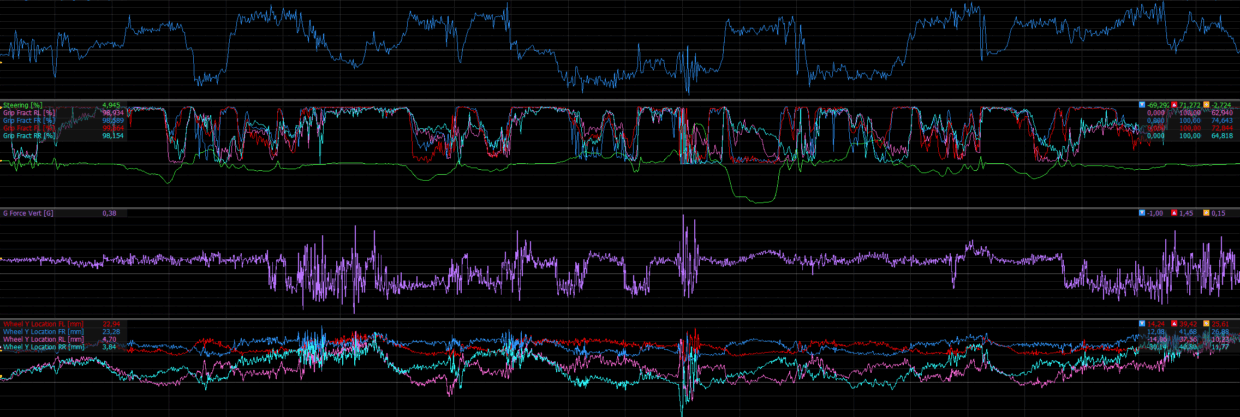
Rather than a visual peak or an average, I extract three indicators:
p95: value reached 95% of the time — the active driving zone;
p99: filtered maximum peak — the useful limit before saturation;
RMS (Root Mean Square): quadratic mean — the underlying chassis effort.
Peugeot 9X8 at Interlagos — measurements:
p99 = 38.012 Nm
p95 = 31.447 Nm
RMS = 20.425 Nm
These numbers form the car’s dynamic fingerprint.
The p95 → p99 range (≈ 7 Nm) is the wheel’s live zone — the bridge between grip and slip.
That’s the range to adapt to the DD motor’s capability.
But how? Hold on tight!
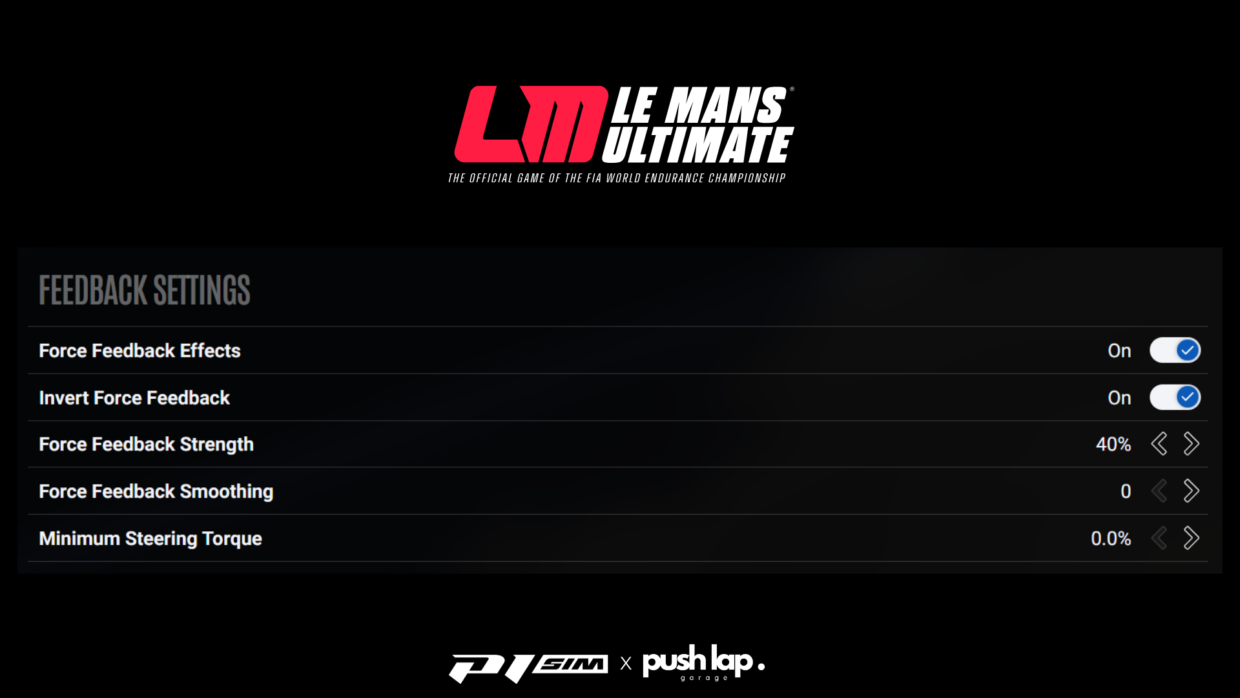
Calculating “Strength” in LMU
To determine the ideal Strength value in Le Mans Ultimate, you scale the game’s gain so that the p99 peak from MoTeC never exceeds the torque actually available on the base.
Goal: reproduce the entire signal without clipping.
Formula:
Strength (game) = ( Headroom × T_max ) / p99
Headroom = 0.90 to 0.97 (I use 0.95)
T_max = maximum torque of the direct drive base
Base at 100% (17 Nm)
(0.95 × 17) / 38.012 ≈ 0.425
Strength 40–41 in-game
SimuCube 2 Sport: 17 Nm at 100%, ≈ 7,84 Nm at 46% max
Ideal balance point: p99 just under the base’s torque limit → zero clipping, full dynamics.
Role of RMS
RMS = 20.425 Nm is used to check the average load.
Rule of thumb:
RMS ≤ 0.6 – 0.7 × (T_max × Strength)
To remember:
Le Mans Ultimate Strength = (0.95 × Direct Drive max torque) / p99
p99 = physical limit to respect
p95 = active driving zone
RMS = load control
Of course, this may seem complicated, but keep in mind that it’s the only method to adjust your direct drive perfectly to the vehicle’s physics — bearing in mind that each vehicle naturally has its own setting (p99, p95, and RMS).
Indicative Reference — LMU Strength Across Popular Direct Drive Bases
As an indicative reference, it’s possible to estimate the Strength value in Le Mans Ultimate based on the maximum torque output of the most common direct drive wheelbases on the market.
These numbers do not replace MoTeC analysis — they are only meant as a starting point before proper calibration.
Each manufacturer has its own signature:
motor characteristics, internal filtering, firmware algorithms, and signal linearity all differ.
That’s why these values should be treated as guidelines, not absolutes — you must refine them according to your own setup and telemetry results.
DD Base | % | Notes |
|---|---|---|
SimuCube 3 Sport (15 Nm) | ±38%
| New V3 architecture — smoother mid-range precision (0.95×15)/38.012 = 0.3749 |
SimuCube 3 Pro (25 Nm) | ±63 % | Perfect for high-load p99 peaks (Hypercars) (0.95×25)/38.012 = 0.6248 |
SimuCube 3 Ultra (35 Nm) | ±88 % | Reproduces full p95–p99 range with zero compression (0.95×35)/38.012 = 0.8747 |
SimuCube 2 Sport (17 Nm) | 40 %* | Reference value of the Push Lap Garage protocol (0.95×17)/38.012 = 0.4250 |
SimuCube 2 Pro (25 Nm) | ±63 % | Very linear, stable thermal behavior (0.95×25)/38.012 = 0.6248 |
SimuCube 2 Ultimate (32 Nm) | ±80 % | Massive torque, requires headroom margin (0.95×32)/38.012 = 0.7998 |
Asetek La Prima (12 Nm) | ±30 % | Quick response, narrow amplitude window (0.95×12)/38.012 = 0.2998 |
Asetek Forte (18 Nm) | ±45 % | Feel close to the SimuCube 2 Sport (0.95×18)/38.012 = 0.4497 |
Asetek Invicta (27 Nm) | ±68 % | Excellent torque-frequency coherence (0.95×27)/38.012 = 0.6745 |
Asetek Intium (5.5 Nm) | ±14 % | Entry-level model, limited headroom (0.95×5.5)/38.012 = 0.1375 |
Moza R9 (9 Nm) | ±23% | Decent dynamics, p99 range slightly compressed (0.95×9)/38.012 = 0.2249 |
Moza R12 (12 Nm) | ±30 % | Softer response in the high-frequency range (0.95×12)/38.012 = 0.2998 |
Moza R16 (16 Nm) | ±40% | Balanced feel between grip and inertia (0.95×16)/38.012 = 0.3998 |
Moza R21 (21 Nm) | ±53 % | Stable torque delivery under load (0.95×21)/38.012 = 0.5247 |
Fanatec CSL DD (8 Nm) | ±20 % | Solid signal quality for its class (0.95×8)/38.012 = 0.1999 |
Fanatec ClubSport DD (12 Nm) | ±30 % | Dense feedback, slightly compressed upper range (0.95×12)/38.012 = 0.2998 |
Fanatec ClubSport DD+ (15 Nm) | ±38 % | Ideal compromise between detail and headroom (0.95×15)/38.012 = 0.3749 |
Fanatec DD1 (20 Nm) | ±50 % | Linear response, excellent for endurance use (0.95×20)/38.012 = 0.4998 |
Fanatec DD2 (25 Nm) | ±63 % | Broad headroom — suited for Hypercars (0.95×25)/38.012 = 0.6248 |
Simagic Alpha EVO (9 Nm) | ±23 % | Agile dynamics, mild low-frequency feel (0.95 × 9) / 38.012 = 0.2249 |
Simagic Alpha EVO (12 Nm) | ±30 % | Well-balanced; benefits from damping refinement (0.95 × 12) / 38.012 = 0.2998 |
Simagic Alpha EVO (18 Nm) | ±45% | Strong precision at high p99 loads (0.95 × 18) / 38.012 = 0.4497 |
*Validated value
All these figures are based on the same principle:
calibrate the game so that the p99 torque peak measured in MoTeC represents about 95 % of the base’s available torque.
This ensures that the entire physical signal is reproduced — with no clipping, no distortion.
However, it is essential to validate these values with your own MoTeC telemetry.
Every base, firmware update, or LMU patch can alter signal behavior.
The key is to measure, then adjust:
start within this range, record a reference lap, review the Steering Shaft Torque trace, and fine-tune both your wheelbase power and LMU Strength until the p95–p99 window is fully used without saturation.
This simple yet rigorous method ensures that each driver can find a torque balance faithful to both their hardware and the physical model of LMU —
a perfect harmony between mechanical realism and digital precision.
Understanding and Calibrating Amplitude
Amplitude is the system’s breathing space: the range in which the motor expresses forces without distortion.
In my protocol, it represents the relationship between maximum force (p99) and the torque actually used by the base. Too low: the signal is smothered. Too high: it saturates.
Each manufacturer has its specifics (motor, firmware, filtering, algorithms).
A Fanatec, a SimuCube, an Asetek won’t behave the same. Amplitude must therefore be hardware-specific: my value isn’t universal truth, but a balance point tied to my test chain.
This paradigm shift is key: we stop talking about power and start talking about signal fidelity.
A well-calibrated amplitude lets the base follow the physics model within its useful range — like a real steering columnunder load.
Frequency Reading of Force Feedback
Brown (2018) breaks down real steering torque into four bands:
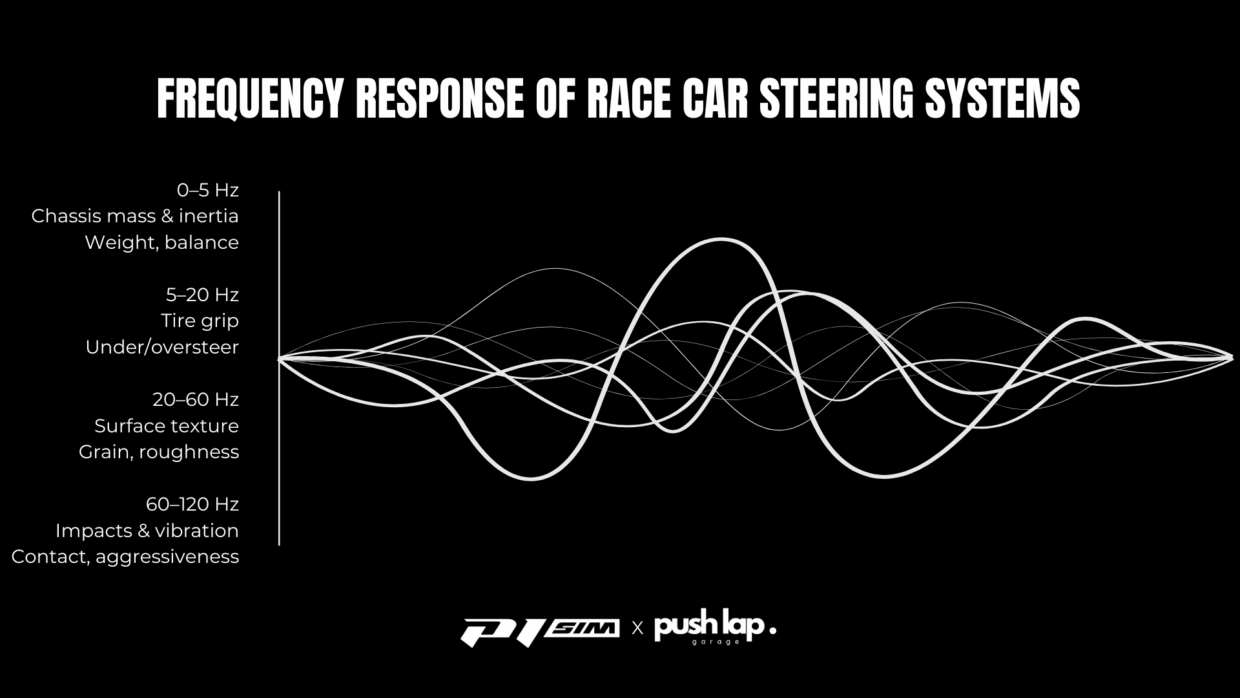
Understanding these bands means understanding what you feel.
The SimuCube 2 Sport can reproduce up to ~120 Hz without filtering: you can therefore perceive the entire LMU spectrum, from chassis load to surface grain. That’s where the truth of the signal lies.
Brake Calibration — MoTeC Reading, Physical & Dynamic Coherence
This curve avoids harshness at the start of travel and maintains firmness at the end — like a real dual master-cylindersystem.
On the P1 SIM Mistral, I use Hard / Very Hard elastomers: firmness, progressivity, and consistency with the deceleration perceived in LMU.
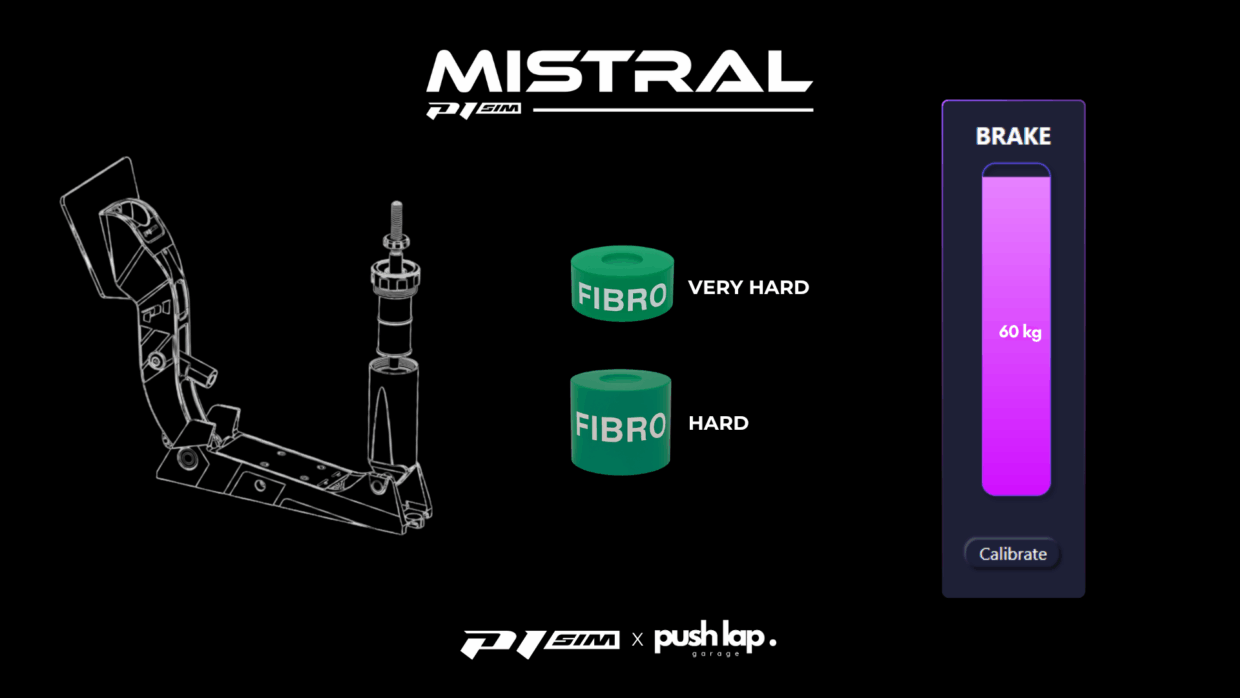
No need to go stiffer: the goal isn’t difficulty, but signal precision.
This approach makes braking measurable, coherent, and repeatable — in line with the calibration principles described by Brandt and Lötzsch: harmonizing physics model, hardware, and human perception.
And since LMU applies a unified physical model across GT and Hypercar categories, a calibration around 60 kgfremains relevant everywhere. The sim doesn’t emulate a different pedal for each car; it relies on a global model (likely based on FIA WEC data).
Physical Limits, Virtual Coherence
In a static simulator, the body doesn’t experience real G-forces. In endurance, a driver takes –2 to –3 G: muscles, blood shift, vestibular load.
In front of a screen, none of that — and yet the brain believes. Why? Because it reads sensory coherence between muscle effort, visual signal, and mechanical feedback.
By calibrating pedal load around 60 kgf, the simulator doesn’t recreate G-force:
it recreates the human perception of G (muscle tension, visual density, gesture/deceleration sync).
The brain interprets this coherence as credible force.
Method Note — 45 kgf vs 60 kgf
In my protocol, 45 kgf corresponds to the measured working effort (≈ 15.7 bar, –2.0 G at Interlagos).
I still set a 60 kgf ceiling (100%) to keep headroom and ensure cross-car consistency.
Concretely: 45 kgf ≈ 95% SimHub output, 60 kgf = 100%
Measured pressure: 15.7 bar
Master cylinder diameter: 19 mm (standard value for GT and LMP cars)
Piston surface area (S): π × (d/2)² = 3.1416 × (0.019/2)² ≈ 2.83 cm²
Conversion: 1 bar = 10⁵ Pa → 15.7 bar = 1.57×10⁶ Pa
Force:
F = 1.57×10⁶ × 2.83×10⁻⁴ ≈ 445 N
Which equals approximately 45 kgf at the pedal.
Mechanical fidelity, no saturation, and margin for variations in tires, tracks, temperatures.
Fascinatingly, this same range works in GT3, LMP2, Hypercar.
Proof that LMU applies a unified model between pedal effort, hydraulic pressure, and deceleration. What changes from car to car is aero and grip, not the braking law.
LMU’s internal consistency is remarkable.
And that may be the heart of modern simulation: not copying raw reality, but reproducing the relationships of forces that make it feel real. Between perception and mechanics, between muscle tension and digital signal, we reach that balance where science becomes sensation.
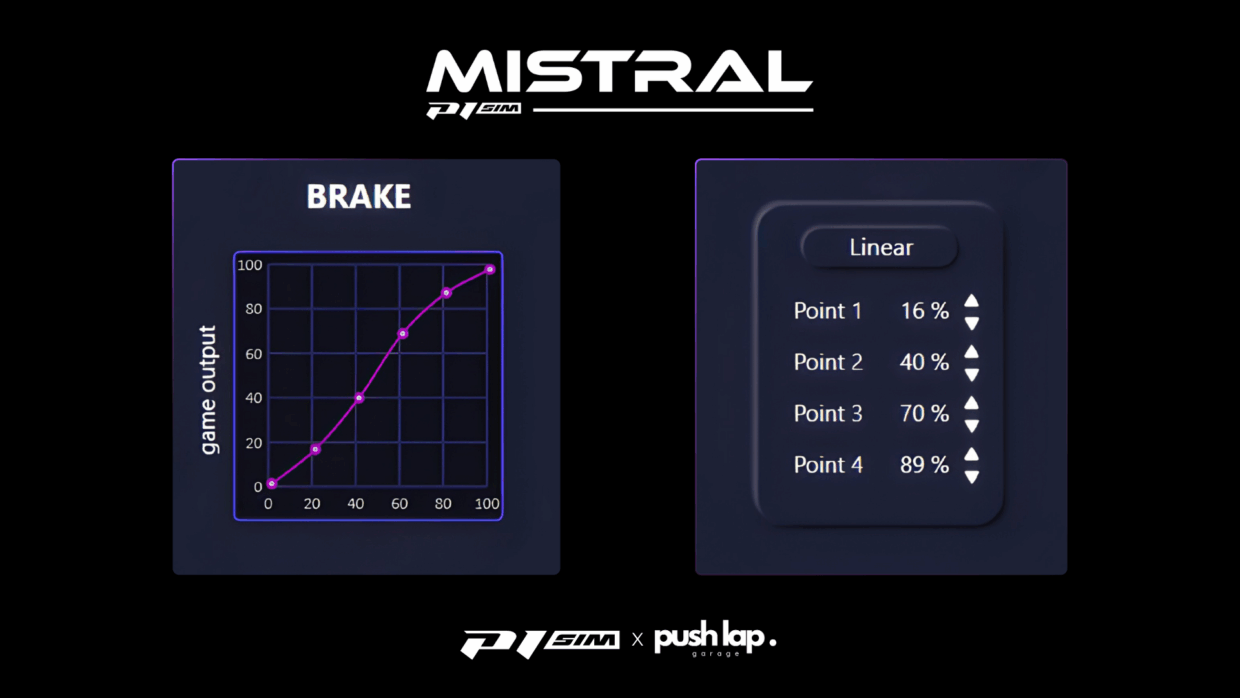
Understanding the Four Points of the Curve P1 SIM
Each point of the curve represents a key braking zone.
They don’t change the actual pressure applied to the pedal, but how the game interprets the signal.
This is where everything happens: between mechanics, electronics, and perception.
By adjusting these four points, we’re not trying to make the brake “stronger,” but more truthful.
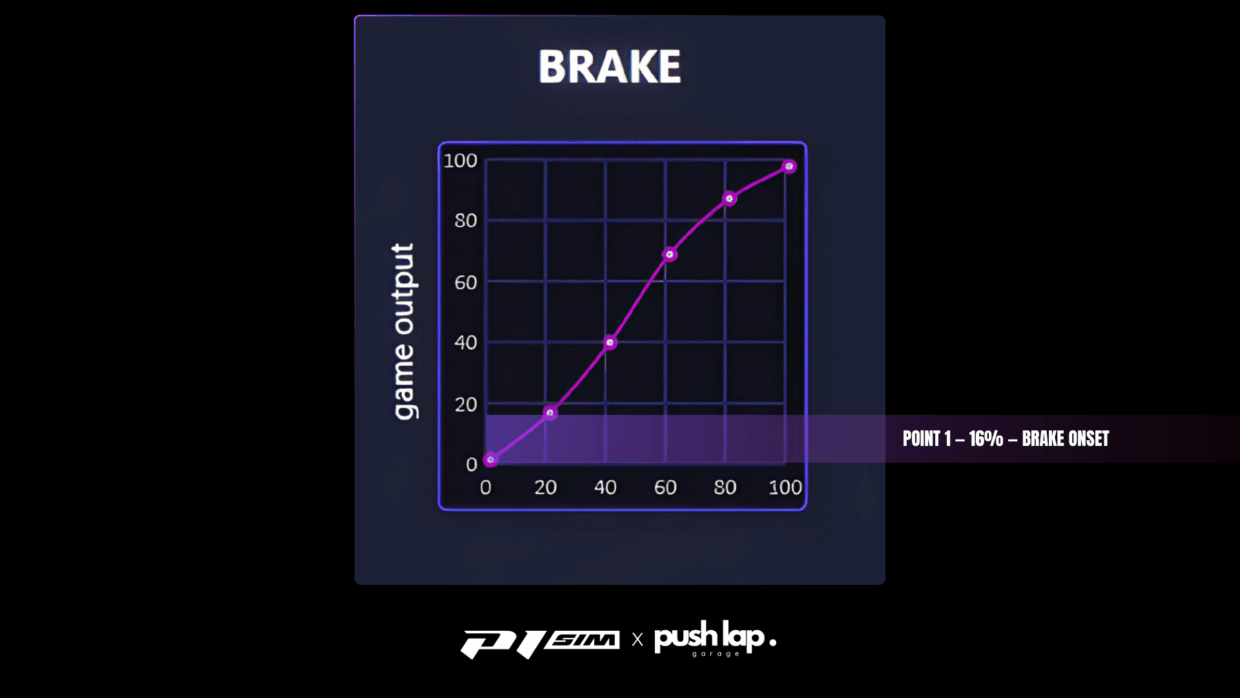
Point 1 — 16% — Brake onset:
The first contact zone, where weight transfer begins.
A lower point softens the rise of the signal: the car settles into deceleration smoothly, helping to stabilize the front axle.
Raise it and the brake becomes more reactive on initial bite. Useful for big straight-line braking, but more demanding when trail-braking.
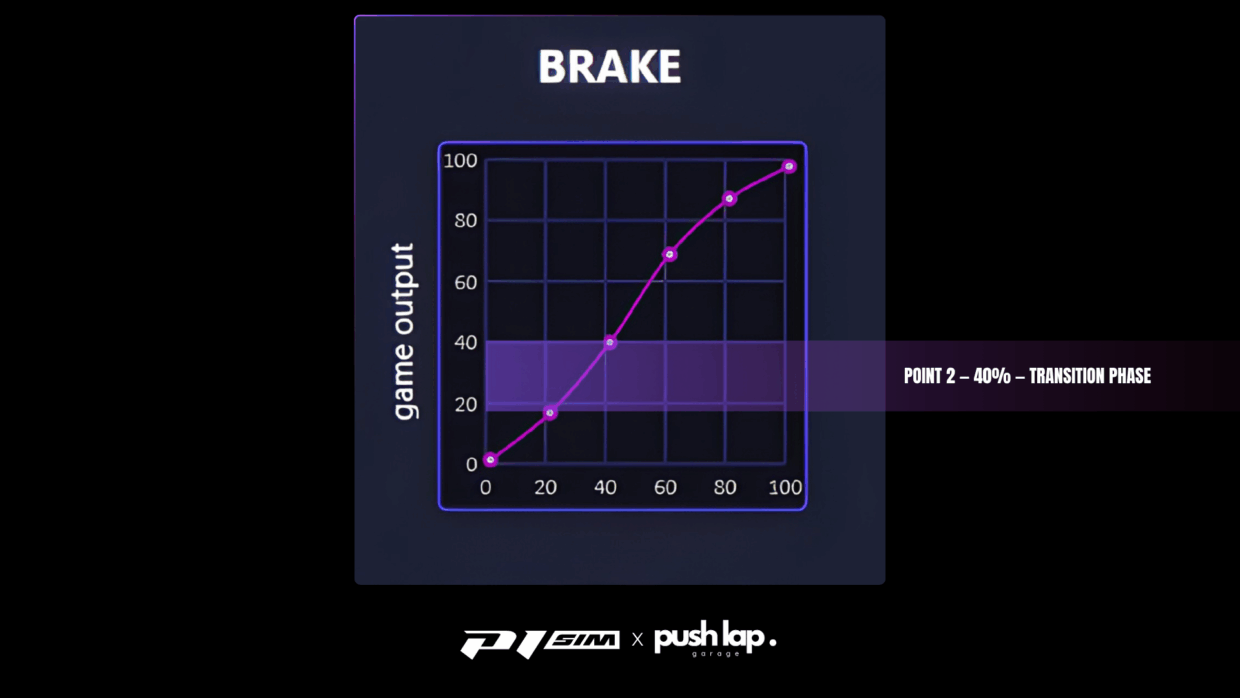
Point 2 — 40% — Transition phase:
Around mid-travel, this point modulates the relationship between initial input and actual load.
Raising it densifies the mid-zone feel underfoot.
Lowering it smooths the curve, favoring a gentle transition between deceleration and release — a setting I often use when the track heats up or the rear gets lively.
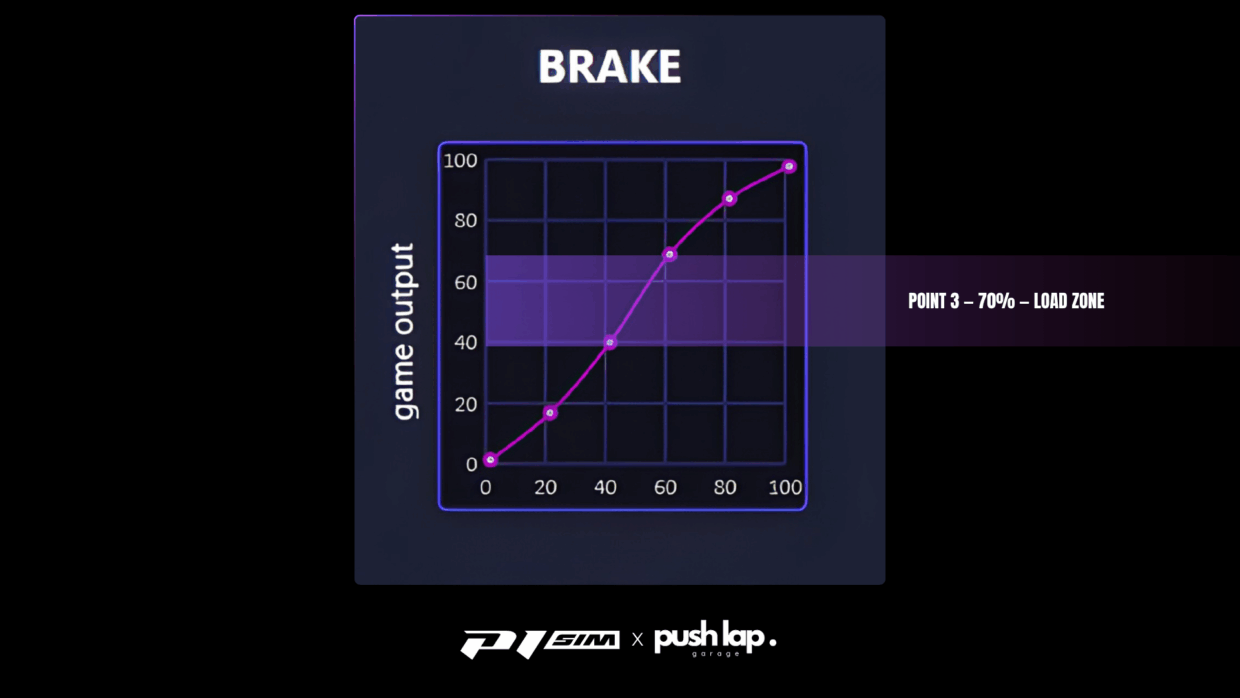
Point 3 — 70% — Load zone:
The heart of braking, where decel peaks.
Raising it brings saturation earlier: the signal rises quickly, power is immediate.
Ideal for high-downforce cars like the Peugeot 9X8, where the first meters are decisive.
Lowering it lengthens travel and modulation for better management of long braking phases — typical in tire or fuel management.
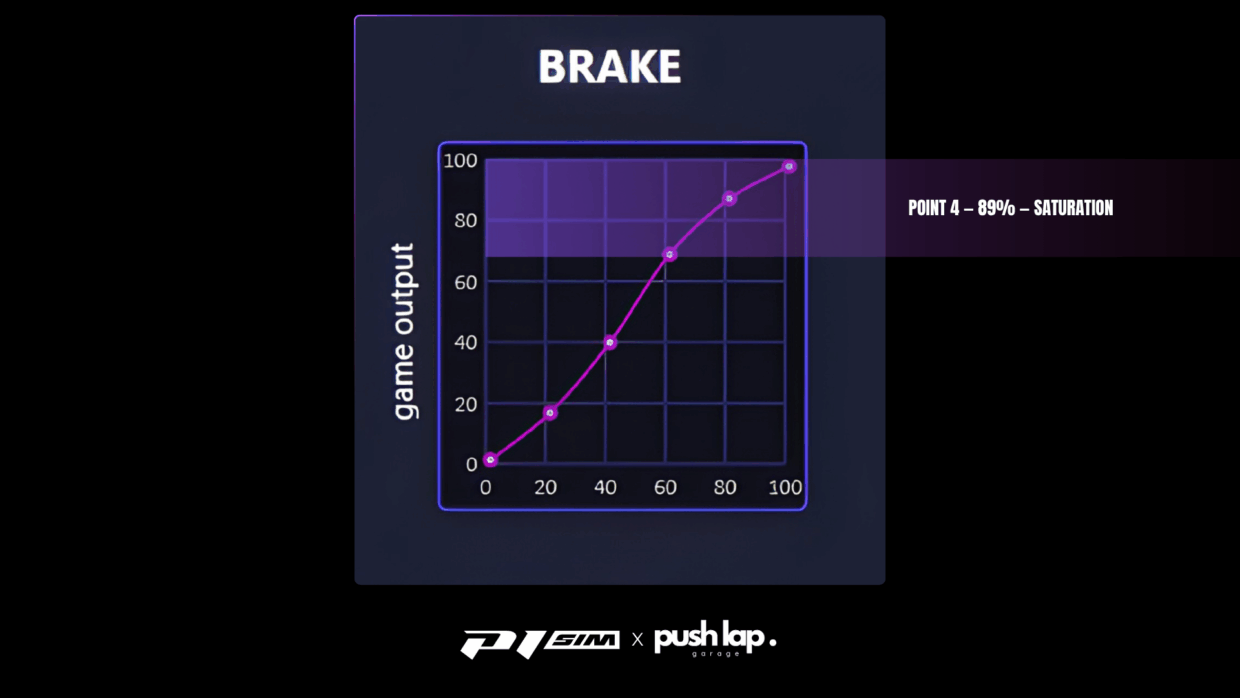
Point 4 — 89% — Saturation:
The last point determines the final firmness of the brake.
The higher it is, the more pressure is needed to reach 100% signal: the pedal becomes physical, but the modulation margin expands.
Lowering it shortens the brake, making it snappier — but also riskier, as lock-up arrives sooner.
In short: the higher the curve, the more aggressive and immediate the response.
The lower it is, the finer and more measurable the modulation.
This curve is the driver’s signature: a compromise between physics and perception, between effort and feedback.
On the P1 SIM Mistral, this tuning perfectly complements the Hard / Very Hard elastomer stack.
The digital curve and physical resistance work together: the former structures the response, the latter gives it texture. And this coherence — between measured pressure, filtered signal, and MoTeC-visible deceleration — is what allows us to speak of braking that is not merely intuitive, but scientifically calibrated. Let’s also keep in mind that your cockpit position influences the result. It’s up to you to adapt based on your needs.
Technical References and Validation Studies
No protocol is built in a vacuum.
Behind every setting and graph, there’s a logic — theorized by engineers and researchers long before we applied it at home.
What I call the Push Lap Garage protocol is the crossing of empirical measurements and scientific work.
Brandt et al. (2020) — High-Fidelity Haptic Simulation for Vehicle Dynamics
Fidelity doesn’t depend on peak force, but on spectral stability (0–100 Hz) and bandwidth coherence between the physical model and mechanical output.
That’s what led me to pursue useful range (headroom) rather than raw power: hence the idea of calibrated amplitudecentered on p95–p99.
Lötzsch et al. (2019) — The Engineering of Steering Feel in Driving Simulators
The driver’s inertial position acts as a frequency filter.
Height ↑ → 20–60 Hz (grip/texture); height ↓ → 0–15 Hz (mass/stability).
This is the basis of my work on the tarmac’s frequency projection.
Brown (2018) — Frequency Response of Race Car Steering Systems
Maps real steering torque into four bands — the reading grid for all my MoTeC analyses.
Without this segmentation, it’s impossible to calibrate the base to reproduce the whole spectrum without distortion.
By combining energetic (Brandt), inertial (Lötzsch), and frequency (Brown) approaches, my protocol becomes a hybrid method: scientific in structure, perceptual in purpose.
Every gain adjustment, every torque measurement, every pedal setting follows the same logic: reproduce real dynamics, not brute force.
That’s my compass: make measurable what we feel, and feel what we measure.
Conclusion — Physics Mastered, Intelligence Ahead
This first chapter closes the physical phase: understanding how forces are built, translated, and balanced. We measured, decoded, and calibrated — not to “feel more,” but to feel right.
And if this level of precision is possible, it’s thanks to the union of two worlds:
P1 SIM (ergonomics, mechanical realism, sensations) × SimuCube (signal purity, torque stability, linearity).
Together, they offer a laboratory of balance, where mechanical rigor meets software finesse — an ideal environment for Le Mans Ultimate.
That’s where Push Lap Garage belongs: between professional hardware and accessible simulation, between the laws of physics and human perception.
But the next step awaits: beyond physics lies signal intelligence — the kind that’s coded and carried within the wheel itself.
Leave a Comment